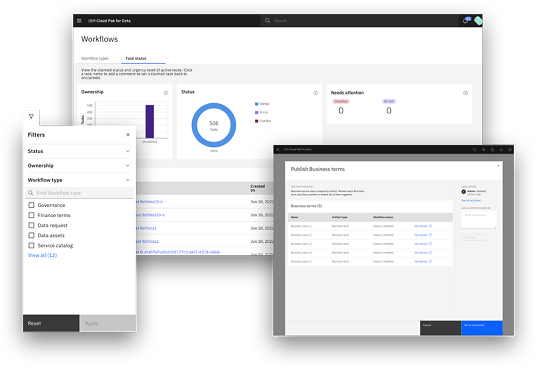
Task Dashboard
Drove cross-functional alignment from research through delivery, using low and high-fidelity prototyping to build a unified task dashboard.

Solved a top industry pain point for Fortune 100 customers.
reduction in issue
resolution for users
- Real-time visibility into workflow progress
- Efficiently identifying bottleneck issues
- Ability to troubleshoot and resolve
Critical Customer Need
Enterprise task management for Fortune 100 operators was fragmented across four disconnected legacy tools, causing operators to spend an hours each day context-switching to track workflow status.
I designed a unified task dashboard that reduced task-switching time by 70%, enabling real-time cross-team visibility and actionable governance controls deployed across 5 product teams and workflow use cases.
Organizational Opportunity
A unified, horizontal task management foundation could serve as shared infrastructure, reduce engineering overhead and improve governance compliance across verticals.
Design Lead
Led UX Designers, a Design Strategist, User Researchers, a Visual Designer, Product Manager, Architect, Developer
Understand
Aligning on the Business and Platform Goals
We began with a general directive to improve the platform's workflow experience by building a dashboard, but the team lacked a clearly defined problem space.
As the design lead, I partnered with Product Management to bring structure to the ambiguity by establishing a research-driven strategy to deepen our understanding of user needs and align the team around a clearer, outcome-focused direction.
Framing Technical Constraints as Opportunities
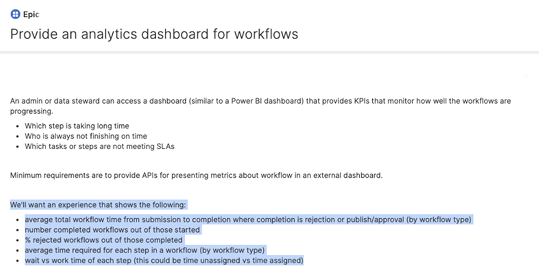
In parallel, I collaborated with Engineering to identify key technical constraints and opportunities related to workflow data and system performance. For example, system data included time-stamped tasks when assigned, which we identified as an opportunity to surface overdue tasks.
Research
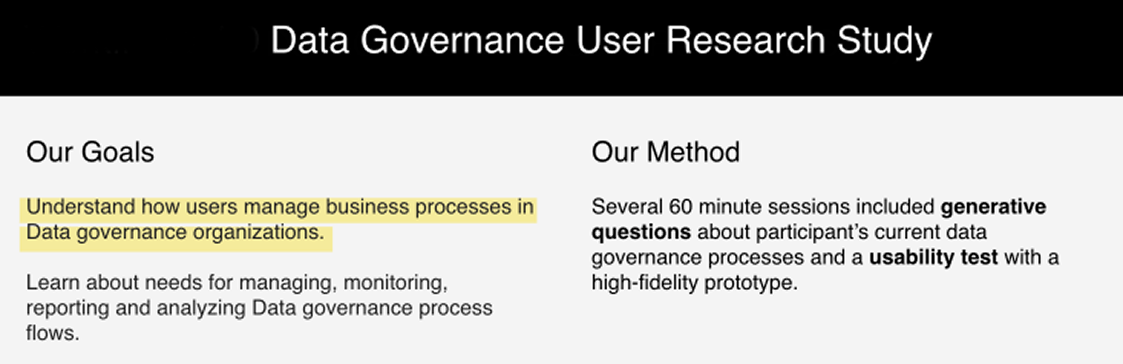
User Research
Aligning Stakeholders Around a Shared Problem Definition
The team entered with strong assumptions about how organizations manage data governance workflows, but still needed to validate their assumptions. I aligned the team around the need to ground decisions with evidence.
Making the Most of Client Engagement
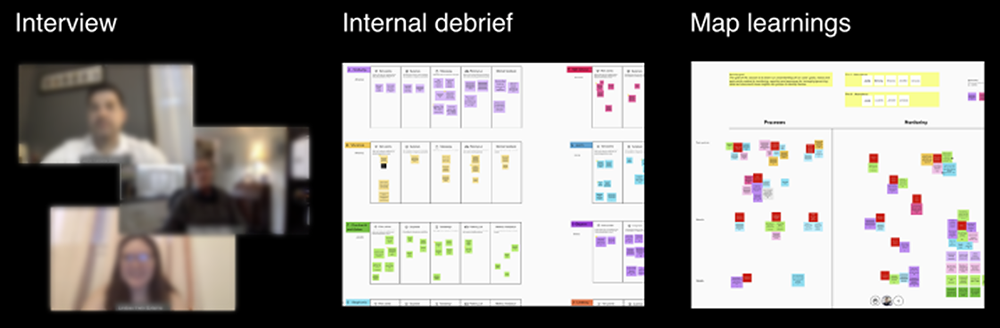
To accelerate learning within tight timelines, I partnered with UX Research to define a focused research plan and secured Product Management buy-in to recruit client participants.
We structured 60-minute sessions that combined generative interviews with prototype walkthroughs, enabling us to uncover critical pain points while validating early concepts such as surfacing overdue tasks on a dashboard to improve workflow visibility.
Key Insight
A critical finding was operators did not need more task data, they needed better task triage. This insight directly led to replacing the 'all-tasks' default view with a task priority-sorted summary and capability to filter running tasks. That single change, validated in subsequent usability testing, was the primary driver of the dashboard design proposal.
Define
Defined Scope and Prioritized Needs
Research created alignment around distinct user roles and their jobs-to-be-done, but we needed to translate insight into a focused product direction.
We synthesized research findings to identify the highest-value, shared dashboard needs—prioritizing where visibility and intervention would deliver the most impact across user types.
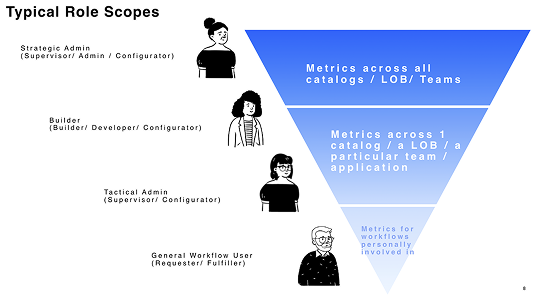
Operationalizing Requirements Across Teams
I defined the core tasks for each role—business users executing work, supervisors monitoring and reporting on workflows, and administrators troubleshooting issues.
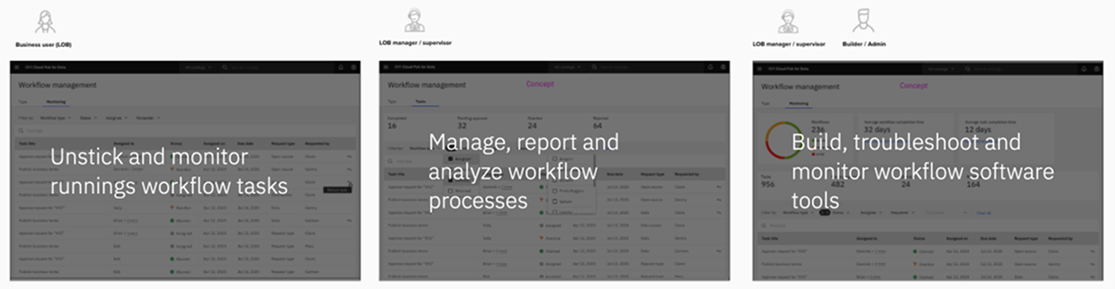
To align cross-functional teams, I developed key artifacts and milestones that made the experience tangible, enabling Product Management to review requirements, designers to clarify features, and Engineering to understand system interactions and dependencies.
Design
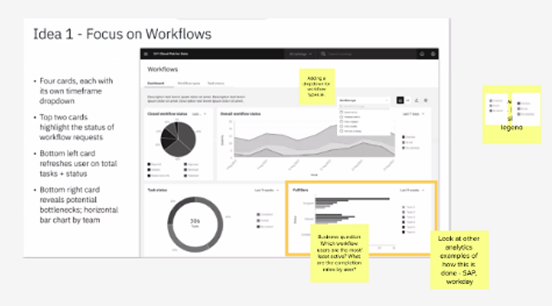
Exploring Solutions and Interaction Models
The process wasn’t ideal but we made it work. I led collaborative design sessions to explore multiple dashboard concepts that balanced high-level process visibility with actionable data while directing our visual designer to explore new infographic patterns.
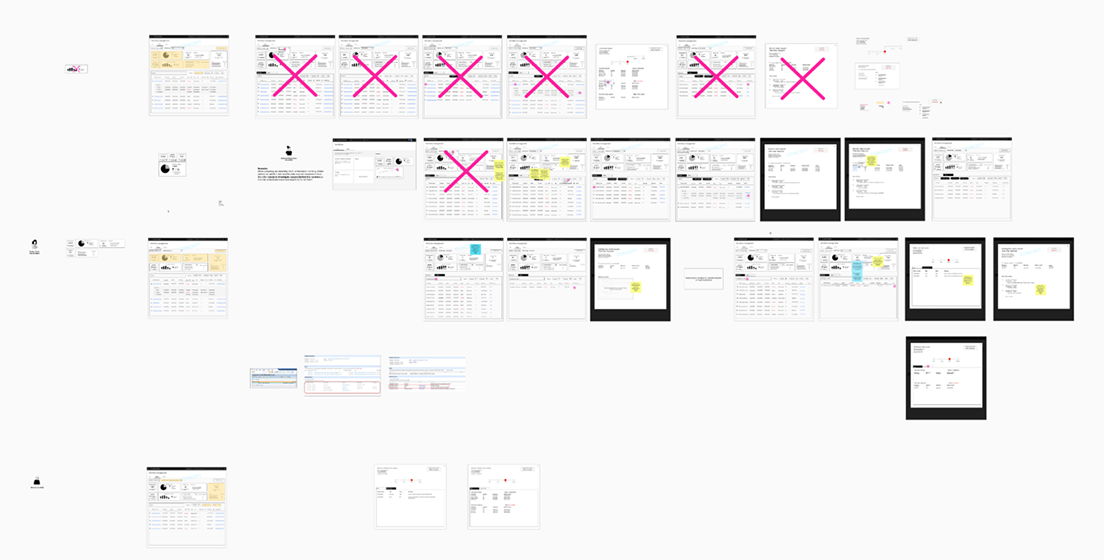
The team iterated in low fidelity across layouts, filtering mechanisms, and visual indicators that would help users quickly identify bottlenecks within complex workflows.
Implement
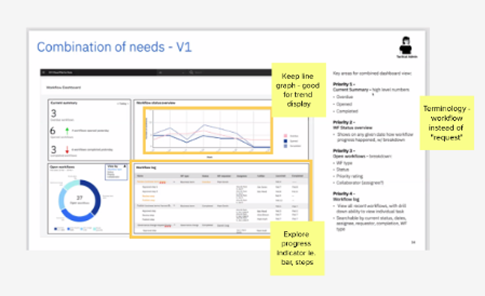
Delivering a Strategic Platform Capability
The final solution provided supervisors and process administrators with real-time visibility into workflow execution, enabling them to quickly identify stalled tasks and resolve bottlenecks.
Beyond solving an immediate customer need, the dashboard strengthened the platform’s competitive position by delivering an operational capability critical to enterprise data governance workflows.
Dashboard Capabilities
- Real-time visibility into workflow execution
- Ability to quickly identify stalled tasks and resolve bottlenecks
- Ability to prioritize tasks and allocate resources effectively
- Ability to monitor workflow performance and identify areas for improvement